Why is it needlessly difficult to access UNFCCC Emission Data?
Due to international climate agreements, countries report annual data about their greenhouse gas emissions to the UNFCCC. However, downloading and using that data is a lot more difficult than it should be.
The United Nations Framework Convention on Climate Change, or UNFCCC, is the UN's process to facilitate climate diplomacy. While its main purpose is to organize climate conferences like the recent COP30 in Belém, Brazil, it also plays an important role in collecting and providing data on climate change and greenhouse gas emissions.
Countries provide their so-called National Inventory Submissions, annual reports about their greenhouse gas emissions, to the UNFCCC in two forms. The National Inventory Reports (NIR) are PDF documents in human language, giving a detailed account of a country's greenhouse gas emissions in various sectors of industry and society.
The Common Reporting Tables (CRT) contain emission data in a standardized tabular format, provided as Microsoft Excel files. Those Common Reporting Tables are quite detailed and can be a valuable source of information for scientists, data journalists, or the interested public.
These reports have been provided since 2003. The data goes even further back. The Common Reporting Tables include emission data since the 1990s. Initially, such reports have primarily been provided by the so-called Annex I countries (a term that goes back to the Kyoto protocol), but in recent years, other countries have also submitted this data to the UNFCCC.
By and large, the Annex I countries have complied with their commitment to providing these reports, with a notable exception. In 2025, the USA have not submitted emission reports to the UNFCCC. As we all know, this is a country that is, unfortunately, ruled by people who believe the best way to tackle climate change is to pretend it does not exist.
Where are the emitting Caprolactam factories? Line 2.B.4.a tells us
The Common Reporting Tables contain emission data broken down to various sectors. We can, for example, learn how much greenhouse gases are emitted by a country's steel industry in Table2(I) in line 2.C.1. It is further broken down into sub-sectors in Table2(I).A-H.
A country's emissions from Methanol production can be found in the same table in line 2.B.8.a. If we want to know how much Caprolactam a country emits, we find that in line 2.B.4.a. (In case you wonder why that may be interesting, I wrote about it here.)
However, if we want to learn about the sources of greenhouse gases, we may not just want to know the emission data for a sector in a single country, but from all countries where data is available. However, this is where things get difficult.
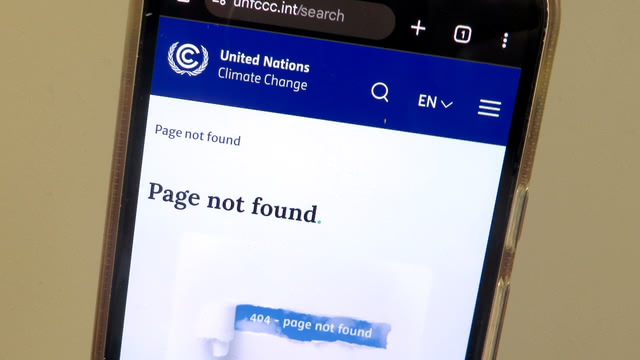
The UNFCCC provides a data interface service that allows searching the emission datasets. However, here is the catch: it is no longer updated. The latest year available in the data interface is 2021, while the latest Common Reporting Tables include data up until 2023.
I asked the UNFCCC why the data is outdated: "Regarding the UNFCCC GHG data interface, it was developed and maintained on the basis of mandates received from Parties. It currently displays data up to 2021, contained in Parties' 2023 submissions. The latest mandate, agreed at SBSTA 62 (June 2025), is to update the data interface to include all data submitted by Parties under the Convention, the Kyoto Protocol, and the Paris Agreement — hence also covering submissions from 2024 onward with emissions data beyond 2021. This update will be implemented subject to the availability of resources."
According to publicly available presentation slides, the UNFCCC was considering whether to update the existing data interface or to include the data in an upcoming new tool called the Climate Data Hub.
This Climate Data Hub was officially launched at the currently ongoing COP30 in Belém. However, "launched" should not be taken too literally. It does not mean that we can use it. It is currently not publicly accessible. The UNFCCC plans to make it publicly available in January 2026, but it will initially not contain emission data. That may be added at a later point in time.
For now, neither the old data interface nor the launched-but-not-public Climate Data Hub gives us access to the latest emission data.
The original data, the Excel files with the Common Reporting Tables, are publicly available. An option would be to download and use them directly. Doing that manually is, however, quite a bit of work.
With a bit of coding skills, it is usually not difficult to automate the job of downloading all the files offered on a web page. However, we are faced with a challenge: the UNFCCC web page actively tries to prevent that.
"Security Firewall" makes automated Data Downloads needlessly difficult
When trying to use automated tools to download data from the UNFCCC web page, it blocks those attempts. The site uses a so-called "Security Firewall" from a company called Imperva.
Why does the UNFCCC treat harmless data downloads like a security problem? Why does it make downloads of data that should be publicly available needlessly difficult? I have asked the UNFCCC this question, but I have not received an answer. It remains unclear what the motivation is.
There are other, less severe but still annoying issues that make working with that data more difficult than it could be. I had reported multiple broken or missing download links to the UNFCCC in the past.
The data is also not entirely consistent across different countries. The Common Reporting Tables are provided as ZIP files, which sometimes contain the Excel tables directly, sometimes there are additional ZIP files inside, and sometimes the data is stored in subdirectories.
It would also be helpful to have all the data combined in a consistent form. A more consolidated version was independently provided by some scientists, but it is no longer updated.
I eventually managed to download all the latest Common Reporting Tables and National Inventory Reports. Instead of manually clicking the download links, I wrote some code utilizing a software called Selenium. It is, essentially, a tool that simulates a user using a browser and clicking all download links.
To help people who want to work with this data, I am sharing the files here. Anyone can download all Common Reporting Tables or all National Inventory Reports for recent years in one file, without any security firewall trying to stop it. I hope this service will be helpful to others. It will be updated and extended over time.
This was the first newsletter of a two-part series about greenhouse gas emission data. In the second part newsletter, I looked into the European Union's emission data for industrial facilities and shared some surprising findings.
I also gave a presentation about emission databases at the Chaos Communication Congress (39C3). A video recording of that 39C3 presentation ("Greenhouse Gas Emission Data - Public, difficult to access, and not always correct") is available here.
Author: Hanno Böck
Brief
-
Clariant's catalyst MegaMax will be used at the Ecoplanta Waste-to-Methanol project in Spain. Ecoplanta is a waste gasification project by Repsol with technology from Enerkem, covered in detail in my last newsletter.
-
In a project called eCO2FORM, the Dutch research organization TNO will investigate the electrochemical conversion of CO₂ to Formic Acid. Formic Acid is a promising potential targets for CO₂ conversion technologies, but it has not yet been done on an industrial scale. (I briefly discussed this here.)
-
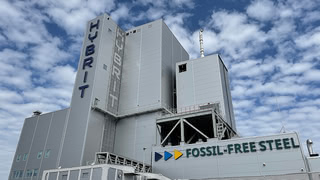
LanzaTech has secured support from the EU Innovation Fund for a project converting industrial gases from a Manganese smelter, operated by Eramet in Norway. LanzaTech is developing a technology to produce Ethanol from industrial gases. I recently covered the Steelanol project in Belgium, which also uses LanzaTech's technology. One conclusion was that it may not be the best idea to use this technology at steel blast furnaces, as those should be replaced by low-carbon alternatives like Hydrogen-DRI, but it could be useful for other metals — like Manganese — where that is not an option.
-
BASF and ExxonMobil plan a demonstration plant for Methane Pyrolysis, sometimes also known as Turquoise Hydrogen, in Baytown (Texas, USA). I covered Turquoise Hydrogen and BASF's previous projects in a previous newsletter. According to Google, it is one of my most searched-for older articles.
-
Air Liquide announced the start-up of its Ammonia Cracker in Antwerp, a plant to convert Ammonia back into Hydrogen. Also in Antwerp, BASF operates a Haber-Bosch plant, converting Hydrogen into Ammonia. Of course, building an Ammonia Cracker close to an Ammonia plant makes no sense, as I explained previously.