Errors and Inconsistencies in European Emission Data
Factories that suddenly have emissions a thousand times lower than before, unexplained data gaps, and inconsistent CO₂ emissions from different data sources are some of the issues one finds when having a closer look at the European Union's emission databases.
In 2003, an international treaty called the Kyiv Protocol on Pollutant Release and Transfer Registers was signed. In it, the signing countries agreed to share data about pollutants released into the environment in public registries.
Based on this treaty and subsequent EU regulation, the European Environmental Agency operates the European Industrial Emissions Portal. Every facility within the EU and some associated countries that releases emissions into the environment above certain thresholds has to report them to a national register.
The Industrial Emissions Portal collects data from all national registers and provides it to the public. Apart from accessing data through a web page, it is also possible to download the complete data. The data contains information about various pollutants, including greenhouse gases like CO₂, N₂O, or more exotic ones like SF₆.
Earlier this year, while researching for a story about CO₂ utilization technologies in Iceland, I checked the CO₂ emissions of various factories there. I noticed that the emission data for some Icelandic factories looked very unusual.
While Iceland is not part of the European Union, it is part of the European Economic Area, which includes non-EU countries that have close ties with it and have adopted many of its regulations. (The European Economic Area is often abbreviated EEA, which is the same abbreviation used for the European Environmental Agency. As both appear in this text, I will not use this abbreviation to avoid confusion.)
Implausible data for Icelandic Ferrosilicon and Aluminium plants
The company Elkem operates a Ferrosilicon plant in Iceland. Ferrosilicon is an alloy of iron and silicon, and its production involves using coal, which causes significant CO₂ emissions.
For 2014 and all previous years, the Industrial Emissions Portal lists CO₂ emissions in the range of 300 to 400 thousand tons annually, a plausible value for such a factory. However, from 2015 to 2017, the data lists no CO₂ emissions at all for Elkem's factory in Iceland. There are no news reports mentioning that the factory was shut down during that time.
In 2018, the factory reported drastically lower emissions of only 404 tons of CO₂, around a thousand times lower than previous values. And in 2019, the emissions dropped again, to now only a third of a ton, a million times lower than previous values.
| Year | Elkem Iceland (kgCO₂) |
|---|---|
| 2013 | 407,000,000 |
| 2014 | 369,000,000 |
| 2015 | - |
| 2016 | - |
| 2017 | - |
| 2018 | 404,000 |
| 2019 | 332 |
| 2020 | 358,000 |
| 2021 | 375,893 |
| 2022 | 361,901 |
While it would certainly be welcome news that a major industrial emitter drops its emissions by many orders of magnitude in a short period, that is probably not what happened here. The data looks implausible and is almost certainly incorrect.
Iceland's largest CO₂ emitter is an Aluminium plant operated by Alcoa. For years 2018 and earlier, the data lists CO₂ emissions above 500,000 tons annually for Alcoa's aluminium plant. But for 2019 and all following years, only around 500 tons of CO₂ emissions are listed. Again, this is almost certainly not the result of implementing emission reduction technologies for almost climate-neutral Aluminium production. (Alcoa is working on something like that - inert Anodes - but the technology has only been adopted in a pilot plant in Canada.)
In both cases, emissions appear to suddenly drop by a factor of around one thousand, and, for one year in Elkem's data, by a factor of a million. It seems likely that what we are seeing here is simply a confusion of units. Data within the European Industrial Emissions Portal is listed in kilograms, and the unusual data points may simply be the values in tons or kilotons.
A massive SF₆ release in Iceland in 2011 - or simply a reporting error?
Another Aluminium plant in Iceland, operated by the company Norðurál, reported 60 tons of SF₆ emissions in 2011. However, it does not report any SF₆ emissions for any other year.
SF₆ is the most potent greenhouse gas known, and emitting 60 tons of it is a lot. Its climate effect over 100 years would be comparable to 1.5 million tons of CO₂. To put that in perspective: Iceland's total CO₂ emissions are around 3.5 million tons.
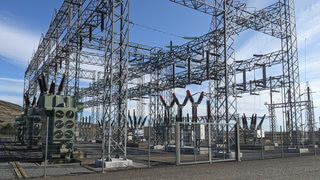
The main use of SF₆ is in electric switchgear, and Aluminium production needs a lot of electricity. It is, therefore, not entirely unexpected that an Aluminium plant will have sizeable amounts of SF₆ in its electric equipment. However, there are no reports of any accidents or unusual events in 2011 that could explain this massive release of SF₆.
I contacted the European Environmental Agency in June 2025 initially about the unusual data for Elkem's Ferrosilicon plant. In their first reply, they informed me that they would contact the responsible Icelandic authorities for clarification. In September 2025, I asked for a status update.
"As mentioned earlier, we referred the matter to the Icelandic data reporter for clarification," the Environmental Agency answered. "Unfortunately, despite our follow-up, we have not received any further information from their side. As the EEA does not produce the data itself but relies on official submissions from its member and cooperating countries, we are unable to provide a more detailed explanation at this stage. With this, we will close the present enquiry. We will nevertheless get back to you if and when we receive clarifications on this matter."
This appeared quite unsatisfying. I asked multiple follow-up questions, and wanted to know whether there was any enforcement of correct data reporting and whose responsibility that would be. The European Environmental Agency referred me to the European Commission (DG Environment).
I also contacted the Icelandic authority responsible for the data reporting, the Icelandic Environment and Energy Agency (Umhverfis- og orkustofnun, UOS). I never received a reply from them. The European Commission initially referred me back to the European Environmental Agency, but then promised to look into it.
The European Emission Trading System uses a different dataset
A key pillar of the European Union's climate policy is the Emission Trading System (ETS). Companies operating within the European Union have to buy emission certificates for CO₂ and some other greenhouse gases they emit. It is a complex system with many exceptions and loopholes, and it is beyond the scope of this text to explain the ETS in detail.
One thing, however, should be apparent: incorrect data on CO₂ emissions can have a significant financial impact. Underreported emissions would mean that a company can avoid payments for ETS certificates, while the European Union would lose money.
However, the Emission Trading System is not based on the data from the Industrial Emissions Portal. The ETS data is shared in another database called the Union Registry.
The fact that there are two data sources for CO₂ emissions provides an obvious opportunity to check whether the data is consistent. There are, however, some key differences between the two databases. Biogenic CO₂ emissions are handled differently (they are not part of the ETS), and greenhouse gases covered by the ETS other than CO₂ (e.g., N₂O) are converted to their CO₂ equivalent values for the Union Database.
Looking at the CO₂ emissions from Elkem's factory in Iceland, the Emission Trading System data looks a lot more plausible. For all reported years, Elkem's factory lists CO₂ emissions of around 300 to 400 thousand tons. The values also confirm that the implausible data points in the Industrial Reporting Portal have probably been entered in the wrong unit, as they are almost exactly off by a factor of one thousand - or, in one case, one million.
Likewise, ETS emissions for Alcoa's Aluminium plant appear plausible as well. For all reported years, the ETS data reports CO₂ emissions between 500 and 600 thousand tons. The values are slightly higher than those reported in the Industrial Emissions Portal, which can be explained by the fact that Fluorcarbon (PFC) emissions from Aluminium plants are also covered by the ETS, and this is represented in a single CO₂ equivalent value.
Data more reliable when it's about Money
Looking at these two plants, it appears that the ETS data is the more reliable data source. This is, to some degree, unsurprising. Within the ETS, large amounts of money are at stake when emissions are misreported. The Industrial Emissions Portal, on the other hand, is "only" about transparency.
While having two data sources provides an opportunity to find errors, unfortunately, connecting the two datasets is not trivial. Factory names are often listed in slightly different ways. Elkem's plant, for example, is listed as "Elkem Ísland ehf." in the Industrial Emissions Portal, and as "Elkem Ísland" in the ETS.
During my investigations, I came into contact with Leonard Stimpfle, a scientist from Ghent University in Belgium. Together with other scientists, he has recently published data that allows linking the two emission data sources.
Leonard Stimpfle had found similar inconsistencies in the emission data and shared further examples with me that were not as easily explained by mistakenly using the wrong unit.
ArcelorMittal operates a steel blast furnace in Dunkirk, France. (This steel plant is an old acquaintance of this newsletter.) Blast Furnaces are amongst the highest emitting industrial facilities, and one can find CO₂ emission data for this plant in both the Industrial Emissions Portal and the ETS. For most years, the values roughly match. But the emission curves diverge from 2013 to 2017.

A similarly strange pattern can be observed for another industrial plant in France, a fertilizer and nitric acid production plant operated by Yara in Ambès. Nitric acid production emits N₂O, which is covered by the ETS, so it is necessary to convert the values with the appropriate global warming potentials. Due to changing scientific knowledge about N₂O's warming impact, the EU changed the Global Warming Potential for the most recent phase of the ETS. (For 2020 and earlier, N₂O is multiplied by a factor of 310. For 2021 and later, the factor is 265.)
After these conversions, the Yara factory shows emissions that are well aligned from 2013 to 2018 and in the latest reported year, 2023. But from 2019 to 2022, the curves diverge.
I have shared these observations with the European Commission, but, to this day, I have not received an explanation. In the case of ArcelorMittal, it is worth mentioning that the values in the Industrial Emissions Portal are higher than those for the Emission Trading System (the latter being the ones that are "about money").
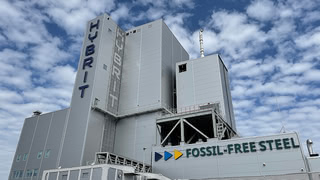
ArcelorMittal's plant in Dunkirk is not the only one of the company showing unusual data. For ArcelorMittal's steel plant in Hamburg, Germany, the Industrial Emissions Portal only lists CO₂ emissions for the year 2007. The Hamburg steel plant is unique, as it is the only direct reduction plant in the European Union. (Direct reduction plants usually use fossil gas, whereas blast furnaces primarily use coal. Direct reduction plants could also utilize green Hydrogen, which is widely seen as the most promising decarbonization pathway for the steel industry.)
In the ETS data, the steel plant in Hamburg is split into three facilities: the direct reduction plant, an electric arc furnace, and a rolling mill. The largest emitter is the direct reduction plant. Its emissions in recent years (2022 to 2024) are below the reporting threshold of 100,000 tons, but emissions from 2013 to 2021 are always above 200,000 tons, significantly above the reporting threshold. Yet, no emission data can be found in the Industrial Emissions Portal.
In all the mentioned cases, I have contacted the affected companies. None of them has, to this day, provided an explanation for the unusual data. (Update: Yara France has answered after the article was already published, see their explanation below.) Likewise, neither the Icelandic nor the French responsible authorities have answered my questions. The European Commission and the European Environmental Agency have answered, but likewise, have not provided any explanation.
The data for the Industrial Emissions Portal has been updated on December 15th 2025. None of the issues mentioned in this text have been corrected.
My findings about emission databases and inaccessible UNFCCC data were the topic of a presentation at the 39th Chaos Communication Congress (39C3) on December 29th (video recording available).
Here you can find various visualizations and tables showing the issues mentioned in the article. If you want to work with the data yourself or create similar visualizations, you can find Open Source scripts to work with the EU emission databases (Docker, MariaDB/SQL, phpMyAdmin) here.
Update (January 2026): I received a reply from Yara France after this article was already published:
"First, the differences between the two curves can be explained by the fact that the ETS data and the data on emissions into the air that we produce on the GEREP tool (electronic declaration of pollutant emissions at the French level) are based on different calculation methods:
- ETS: The data is mainly derived from continuous measurements of N₂O emissions (hourly average emissions). These more accurate data are validated by an accredited body. They represent total CO₂ emissions: N₂O expressed as CO₂ from continuous measurements + CO₂ from other plant locations (auxiliary boiler, etc.). Once validated, they are filled in in the ETS section of the GEREP tool.
- Air emissions curve: these are quantities of N2O expressed in CO2 eq, which are calculated automatically by the GEREP tool based on an average flow rate and average concentration that we provide. This data is then verified and consolidated by the French authorities before being reported to the European authorities under the E-PRTR regulation.
The difference between the two curves can be explained by these methodological differences, which can lead to significant differences depending on the year.
In terms of the declaration of air emissions in 2021, the difference is indeed greater, and this is a point that we noted in our declaration to the French authorities."
I also received a reply from the German Environmental Agency (UBA, Umweltbundesamt) about the ArcelorMittal Hamburg steel plant. According to UBA, the direct reduction plant is not covered by the EU regulation for the Industrial Emissions Portal.
The corresponding EU regulation lists the following as an activity that would have to report its emissions: "Production of pig iron or steel (primary or secondary fusion) including continuous casting, with a capacity exceeding 2,5 tonnes per hour".
Indeed, this leaves some room for interpreation, as "pig iron" usually refers to molten iron from a blast furnace, while a direct reduction plant produces what is commonly called "sponge iron". However, a direct reduction plant still is part of the production of primary steel, and the capacity of the Hamburg steel plant is clearly above the noted threshold.
To make matters even more ambiguous, the German version of the relevant EU regulation uses the word "Rohstahl" to translate "Pig Iron". The same word is used in other places of the regulation as a translation for "Crude Steel". One might argue that under the German version of the corresponding regulation, the plant should report its emissions, while under the English version, it might not have to do so.
Author: Hanno Böck
Updates
In last month's newsletter, I covered the case of a chemical plant operated by Solvay in Germany that reported SF₆ emissions orders of magnitude too low and the same emission value over multiple years.
I mentioned that SF₆ gas was used in Nike shoes up until 2006, and that this was first highlighted by a German magazine. Through feedback from readers, I learned that this was an article in the "Stiftung Warentest" magazine, a consumer product testing organization. The magazine is simply called "Test", and the SF₆ issue was highlighted in a short article in August 1992. One of my readers contacted Stiftung Warentest and was able to get a scan of that 1992 article.
I also created a video presentation about SF₆ and the recent findings.
Brief
-
In Zhanjiang in China's Guangdong province, the company CIMC Enric started operating a biomethanol plant based on biomass gasification with a production capacity of 50,000 tons annually. Earlier this year, a combined bio-e-methanol project by Shanghai Electric also started operations. Green methanol is a recurring topic in this newsletter and a potentially promising climate solution for certain sectors. Multiple other large-scale green Methanol projects in China are planned or under construction.
-
The German NGO Deutsche Umwelthilfe is legally challenging several coal and oil companies for not reporting Methane emissions from their operations.